Causal loop diagrams help us capture a shared understanding of complex problems and provide insights in where to intervene.
A causal loop diagram (CLD) is a visual mapping tool used to represent the cause-and-effect relationships among various elements in a system. These diagrams help us explain how these cause-and-effect interactions form feedback loops that can balance or reinforce changes in the system.
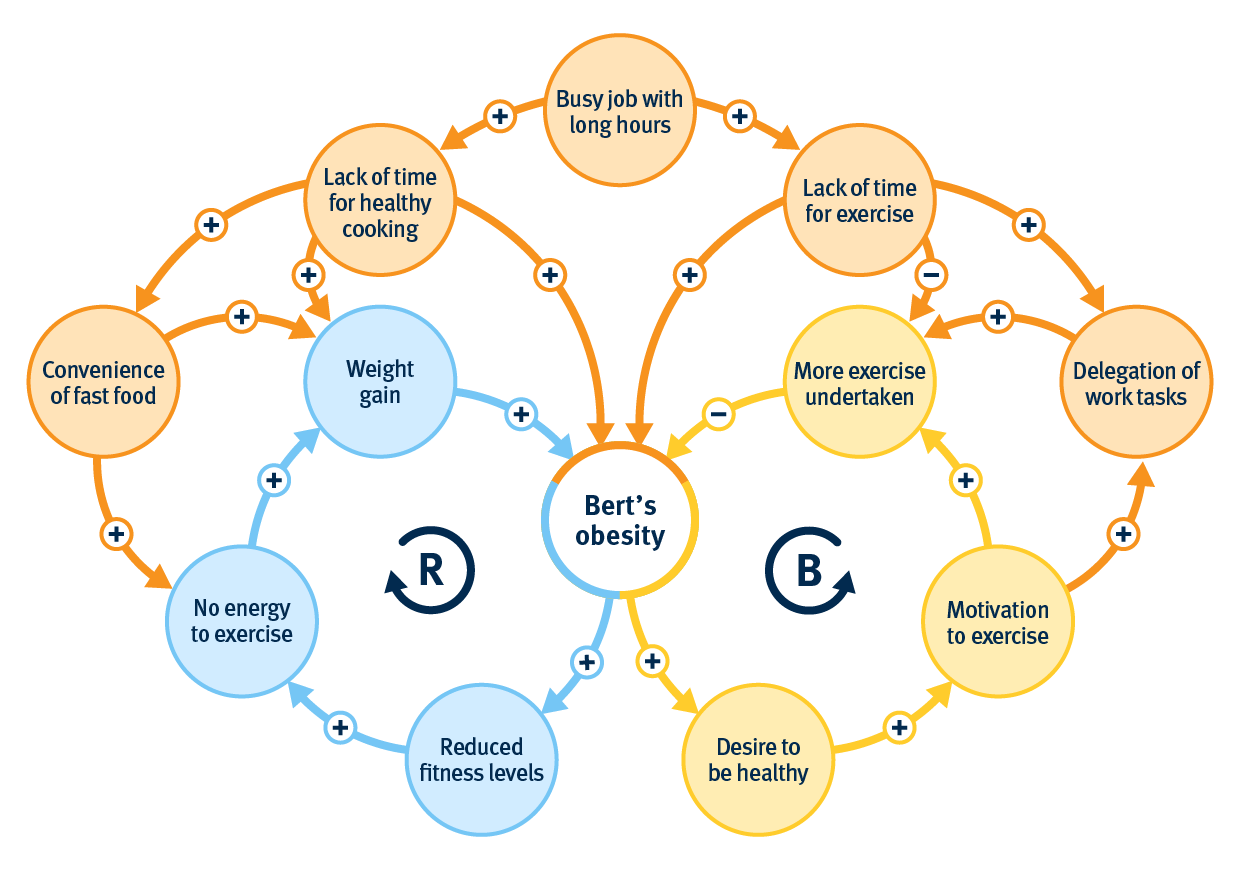
Example CLD showing the balancing and reinforcing feedback loops leading to a person's obesity.
Causal loops explore how variables within a system interact. Interactions provide insight into positive, unwanted interactions and unintended consequences. Causal loops can be useful for improving health systems due to their complex, dynamic nature and the large number of interactions that occur within them.
Causal loop diagrams also allow us to examine and describe specific feedback loops that might occur within systems.
To improve your skills developing Causal Loop Diagrams:
-
Practice creating and analysing CLDs for different problems. Use real-world examples or case studies.
-
Search the term, 'PubMed' for informative articles.
-
Collaborate with peers to seek advice and varying opinions.
-
Explore online platforms and software like Kumu and LOOPY to create, edit, and share CLDs.
